── Attaching core tidyverse packages ──────────────────────── tidyverse 2.0.0 ──
✔ dplyr     1.1.4     ✔ readr     2.1.5
✔ forcats   1.0.0     ✔ stringr   1.5.1
✔ ggplot2   3.5.2     ✔ tibble    3.3.0
✔ lubridate 1.9.4     ✔ tidyr     1.3.1
✔ purrr     1.1.0
── Conflicts ────────────────────────────────────────── tidyverse_conflicts() ──
✖ dplyr::filter() masks stats::filter()
✖ dplyr::lag()    masks stats::lag()
ℹ Use the conflicted package (<http://conflicted.r-lib.org/>) to force all conflicts to become errors
Import the cleaned .RData
load("military_clean.RData")
List your questions
What are the top 10 countries with the highest military spending as a percentage of GDP in 2024?
What are the top 3 countries in Asia with the highest military spending as a percentage of GDP in 2024?
What are the top 10 countries with the highest average military spending from 2014 to 2024?
What are the top 3 countries in Asia with the highest average military spending from 2014 to 2024?
Which region has the highest average military spending as a percentage of GDP in 2024?
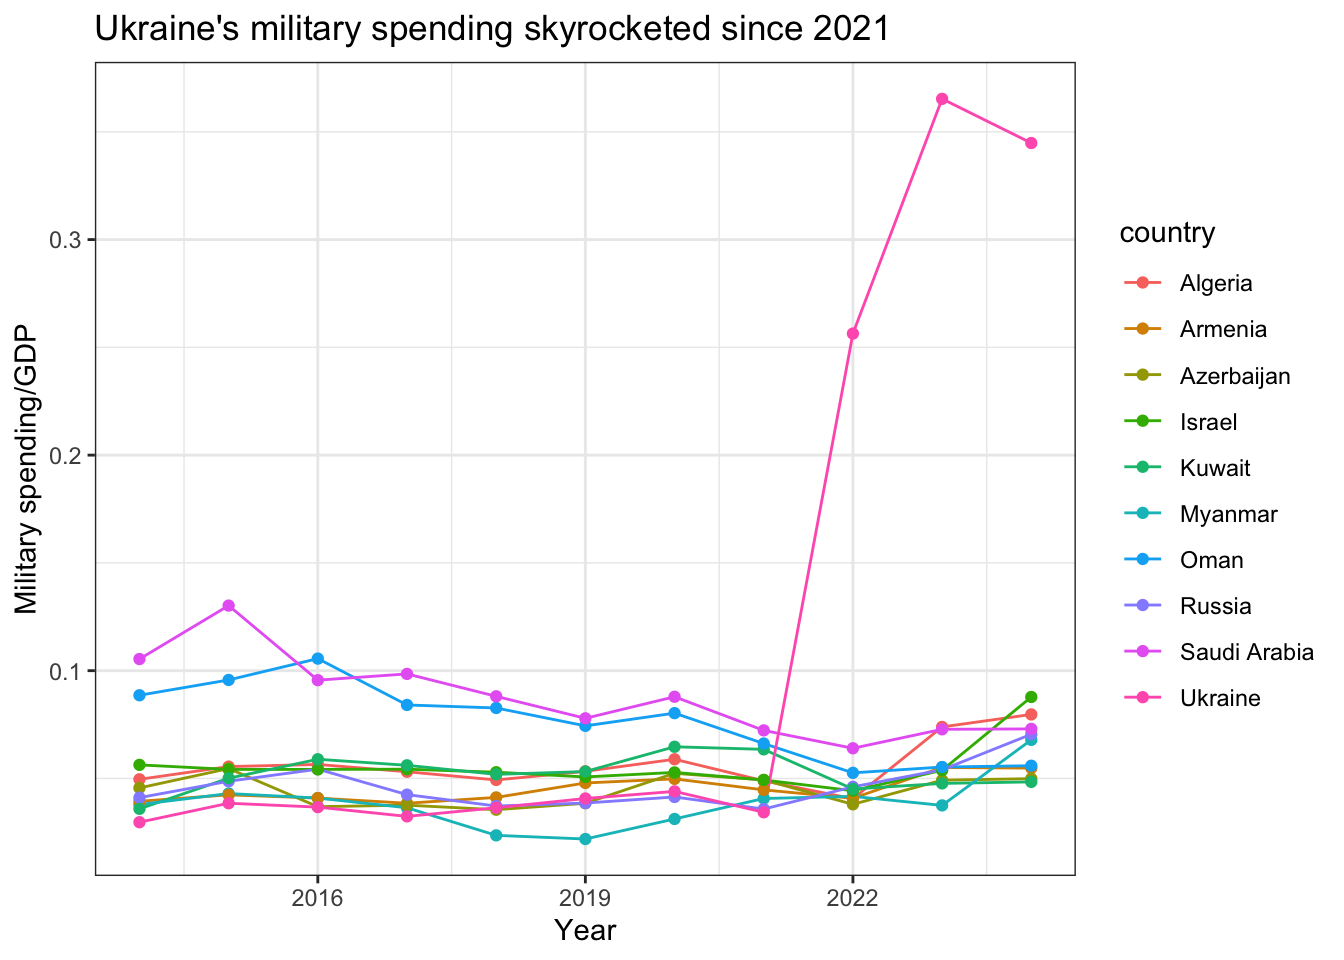
For the top 10 countries with the highest military spending as a percentage of GDP in 2024, the line plot maps the trend in their military spending as a percentage of GDP from 2014 to 2024.
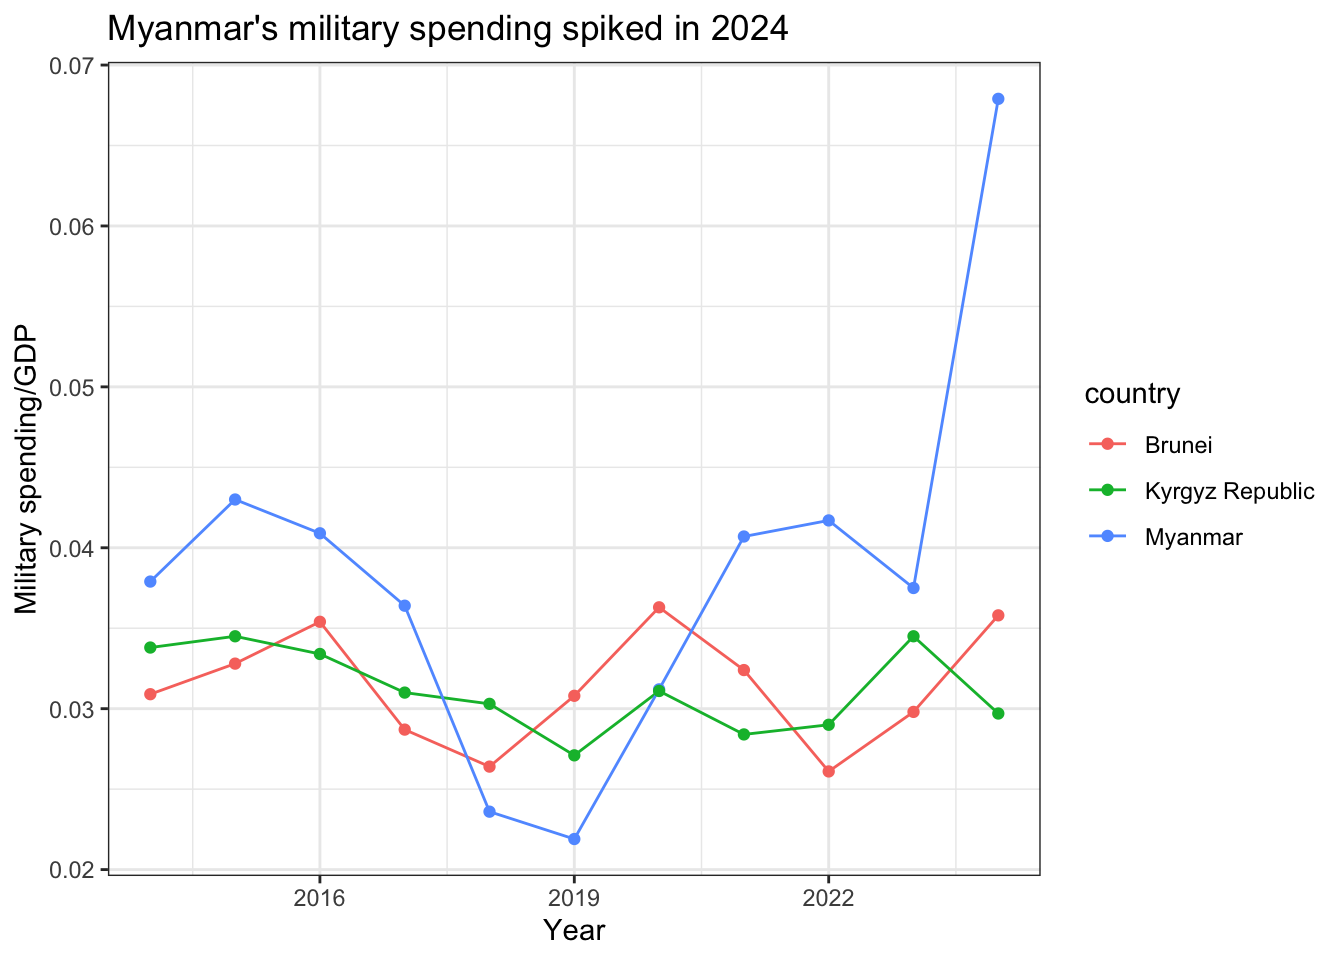
For the top 3 Asian countries with the highest military spending as a percentage of GDP in 2024, the line plot maps the trend in their military spending as a percentage of GDP from 2014 to 2024.
Answer each question in order
#1) What are the top 10 countries with the highest military spending as a percentage of GDP in 2024?
# A tibble: 10 × 4
   country      region       year spending
   <chr>        <chr>       <dbl>    <dbl>
 1 Ukraine      Europe       2024   0.345
 2 Israel       Middle East  2024   0.0878
 3 Algeria      Africa       2024   0.0797
 4 Saudi Arabia Middle East  2024   0.073
 5 Russia       Europe       2024   0.0705
 6 Myanmar      Asia         2024   0.0679
 7 Oman         Middle East  2024   0.0559
 8 Armenia      Europe       2024   0.0548
 9 Azerbaijan   Europe       2024   0.0499
10 Kuwait       Middle East  2024   0.0484
#The top 10 countries with the highest military spending as a percentage of GDP in 2024 are: Ukraine, Israel, Algeria, Saudi Arabia, Russia, Myanmar, Oman, Armenia, Azerbaijan, and Kuwait. Ukraine has the highest military spending as a percentage of GDP of 34.5%.
#2) What are the top 3 countries in Asia with the highest military spending as a percentage of GDP in 2024?
# A tibble: 3 × 4
  country         region  year spending
  <chr>           <chr>  <dbl>    <dbl>
1 Myanmar         Asia    2024   0.0679
2 Brunei          Asia    2024   0.0358
3 Kyrgyz Republic Asia    2024   0.0297
top_3_list <- top_3$country#The top 3 Asian countries with the highest military spending as a percentage of GDP in 2024 are: Myanmar, Brunei, and Kyrgyz Republic. Myanmar had the higest spending: 6.8% of GDP.
#3) What are the top 10 countries with the highest average military spending from 2014 to 2024?
# A tibble: 10 × 2
   country              avg_spending
   <chr>                       <dbl>
 1 Ukraine                    0.114
 2 Saudi Arabia               0.0878
 3 Libya                      0.0837
 4 Oman                       0.0765
 5 Qatar                      0.0648
 6 United Arab Emirates       0.0564
 7 Algeria                    0.0563
 8 Israel                     0.0555
 9 Kuwait                     0.0523
10 Russia                     0.0464
#The top 10 countries with the highest average military spending from 2014 to 2024 are: Ukraine, Saudi Arabia, Libya, Oman, Qatar, United Arab Emirates, Algeria, Israel, Kuwait, Russia. Ukraine spent on average 11.4% of their GDP per year on military spending during the 10 years.
#4) What are the top 3 countries in Asia with the highest average military spending from 2014 to 2024?
# A tibble: 3 × 2
  country  avg_spending
  <chr>           <dbl>
1 Myanmar        0.0384
2 Pakistan       0.0323
3 Brunei         0.0314
#The top 3 countries in Asia with the highest average military spending from 2014 to 2024 are: Myanmar, Pakistan and Brunei. Myanmar spent on average 3.8% of their GDP per year on military spending during the 10 years.
#5) Which region has the highest average military spending as a percentage of GDP in 2024?
# A tibble: 1 × 2
  region      avg_spending
  <chr>              <dbl>
1 Middle East       0.0398
#The Middle East has the highest average military spending as a percentage of GDP in 2024, spending around 4% of their GDP in military spending.
###Chart 1: For the top 10 countries with the highest military spending as a percentage of GDP in 2024, the line plot maps the trend in their military spending as a percentage of GDP from 2014 to 2024.
df_clean |>filter(year >=2014) |>filter(country %in% top_10_list) |>ggplot(aes(x = year, y = spending, color = country)) +geom_line() +geom_point() +theme_bw() +labs(title ="Ukraine's military spending skyrocketed since 2021",x ="Year",y ="Military spending/GDP")
###Chart 2: For the top 3 Asian countries with the highest military spending as a percentage of GDP in 2024, the line plot maps the trend in their military spending as a percentage of GDP from 2014 to 2024.
df_clean |>filter(year >=2014) |>filter(country %in% top_3_list) |>ggplot(aes(x = year, y = spending, color = country)) +geom_line() +geom_point() +theme_bw() +labs(title ="Myanmar's military spending spiked in 2024",x ="Year",y ="Military spending/GDP")
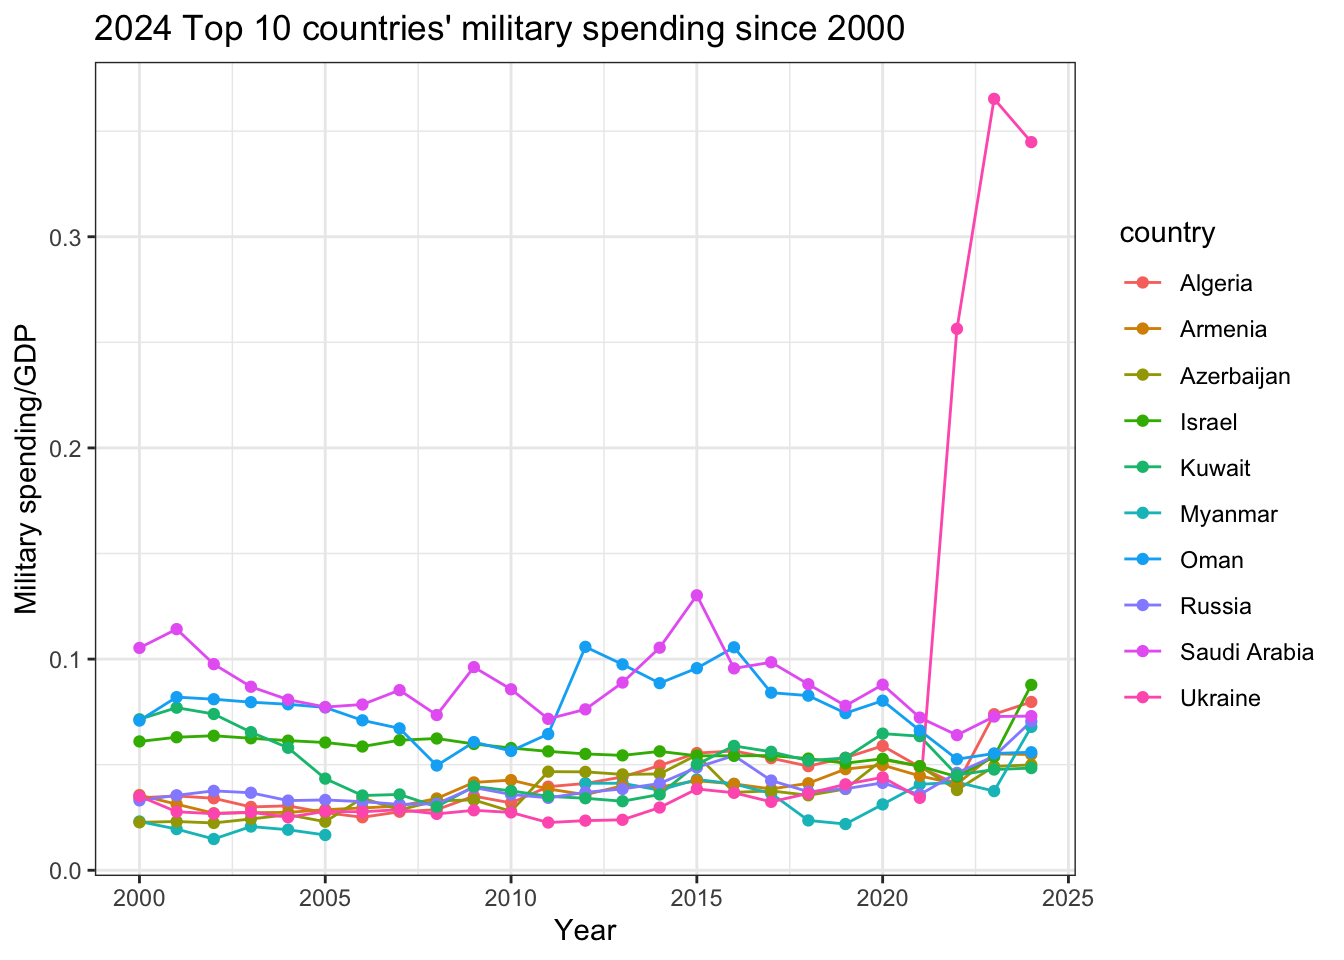
###Chart 3: For the top 10 countries with the highest military spending as a percentage of GDP in 2024, the line plot maps the trend in their military spending as a percentage of GDP from 2000 to 2024.
df_clean |>filter(year >=2000) |>filter(country %in% top_10_list) |>ggplot(aes(x = year, y = spending, color = country)) +geom_line() +geom_point() +theme_bw() +labs(title ="2024 Top 10 countries' military spending since 2000",x ="Year",y ="Military spending/GDP")
Warning: Removed 6 rows containing missing values or values outside the scale range
(`geom_point()`).
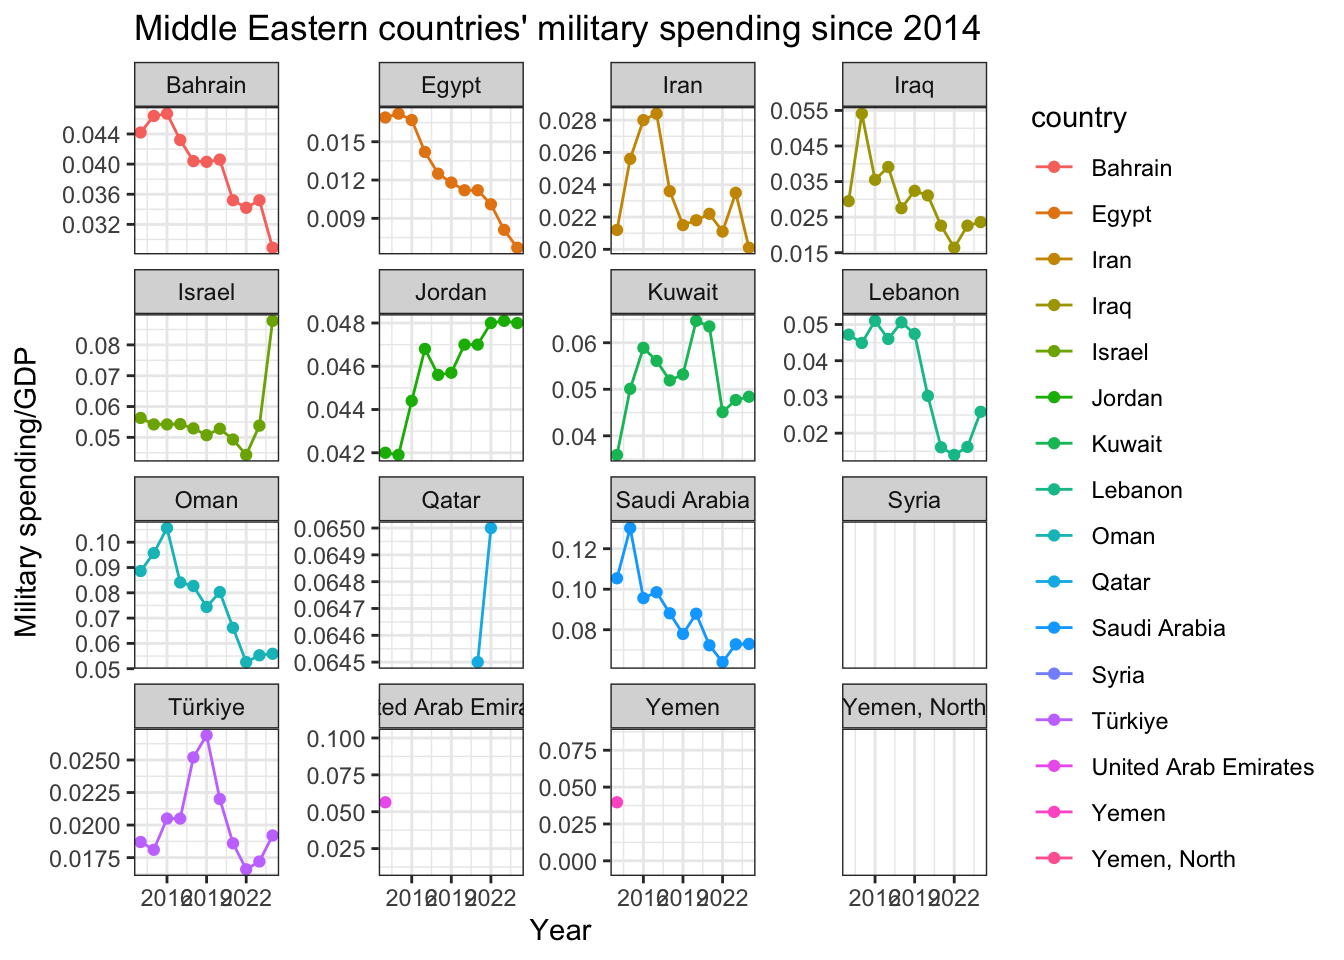
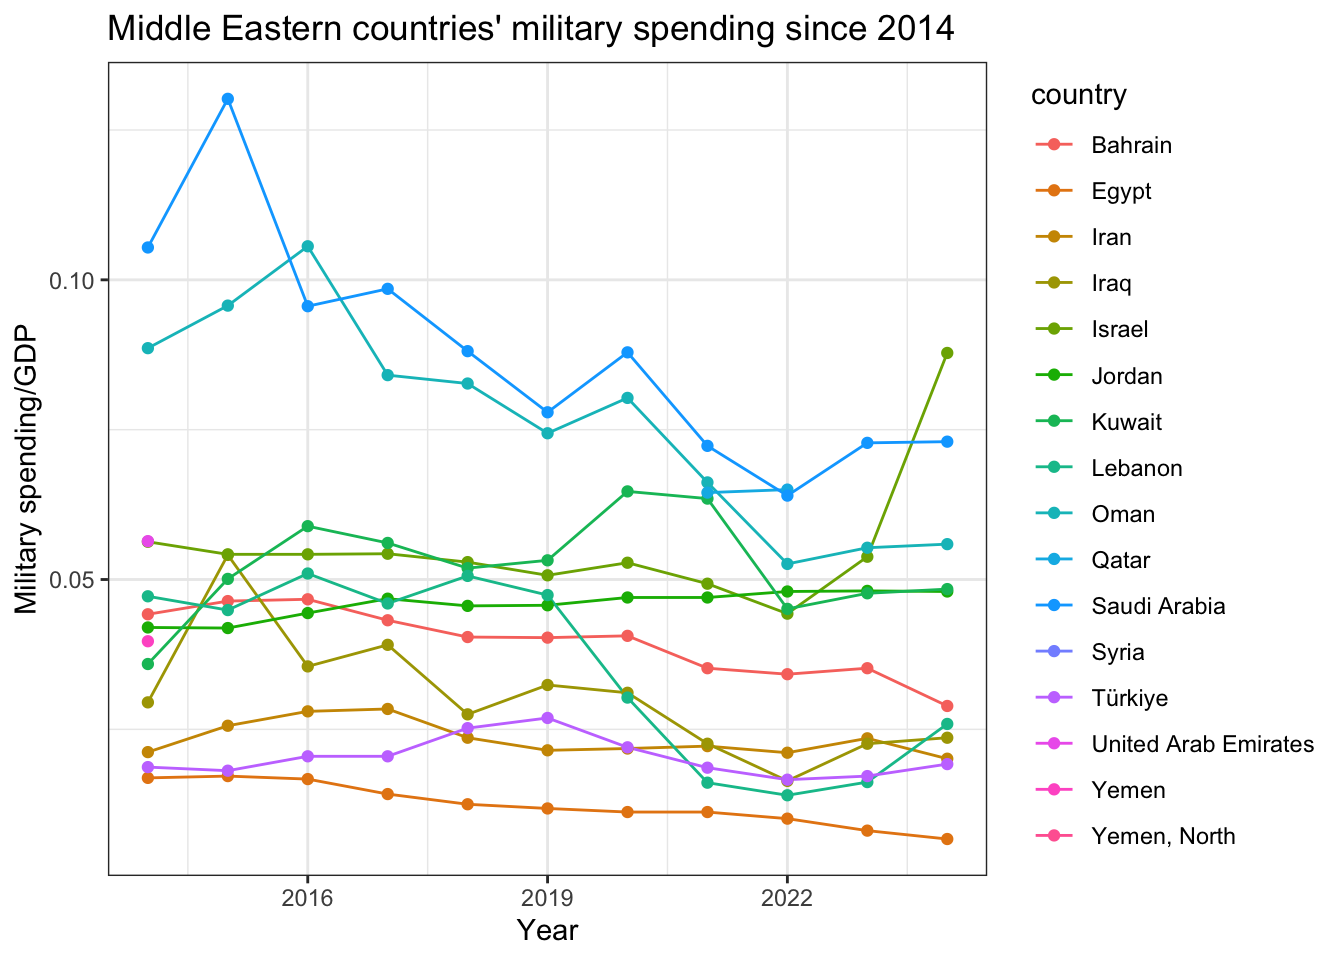
###Chart 4: For the countries in the Middle East,the line plot maps the trend in their military spending as a percentage of GDP from 2014 to 2024.
p1 <- df_clean |>filter(year >=2014) |>filter(region =="Middle East") |>ggplot(aes(x = year, y = spending, color = country)) +geom_line() +geom_point() +theme_bw() +labs(title ="Middle Eastern countries' military spending since 2014",x ="Year",y ="Military spending/GDP") +facet_wrap(~country, scales ="free_y")p1
Warning: Removed 51 rows containing missing values or values outside the scale range
(`geom_line()`).
`geom_line()`: Each group consists of only one observation.
ℹ Do you need to adjust the group aesthetic?
`geom_line()`: Each group consists of only one observation.
ℹ Do you need to adjust the group aesthetic?
Warning: Removed 51 rows containing missing values or values outside the scale range
(`geom_point()`).
#Israel is the only country seeing a significant increase in military spending as a percentage of GDP from 2014 to 2024.
# Save plot as PNGggsave("middleeast.png", plot = p1, width =8, height =6)
Warning: Removed 51 rows containing missing values or values outside the scale range
(`geom_line()`).
`geom_line()`: Each group consists of only one observation.
ℹ Do you need to adjust the group aesthetic?
`geom_line()`: Each group consists of only one observation.
ℹ Do you need to adjust the group aesthetic?
Warning: Removed 51 rows containing missing values or values outside the scale range
(`geom_point()`).
df_clean |>filter(year >=2014) |>filter(region =="Middle East") |>ggplot(aes(x = year, y = spending, color = country)) +geom_line() +geom_point() +theme_bw() +labs(title ="Middle Eastern countries' military spending since 2014",x ="Year",y ="Military spending/GDP")
Warning: Removed 51 rows containing missing values or values outside the scale range
(`geom_line()`).
Warning: Removed 51 rows containing missing values or values outside the scale range
(`geom_point()`).